KEY CAPABILITIES
What you can do with NetScaler application and ADC analytics
3
icon,transparent

medium
Use real-time reporting to troubleshoot application, API, and ADC performance issues and end-user access failures
h3
icon,transparent

medium
Get detailed insights into session performance and application end-user behavior and experience
h3
icon,transparent

medium
Use predictive analytics to optimize your ADC infrastructure capacity for peak application performance
h3
icon,transparent

medium
See every historical web transaction to pinpoint application performance problems
h3
icon,transparent

medium
Gain deep observability into application performance and security using NetScaler service graphs or your preferred monitoring-tool data imported into NetScaler
h3
icon,transparent

medium
Know exactly which CVEs are impacting your ADC infrastructure
h3
KEY FEATURE
Get real-time network, infrastructure, and application insights with global service graphs
NetScaler application and ADC analytics at a glance
3
transparent
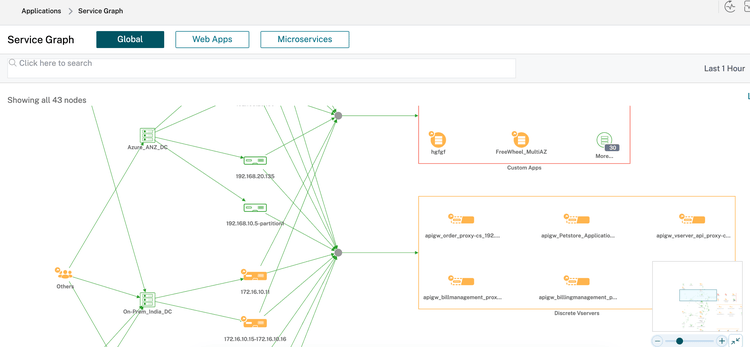
Service graphs for real-time status updates
h3
NetScaler service graphs provide the live status of your network by showing a spatial representation of your global ADC and compute infrastructure. Get a big-picture view of the communications between clients, NetScaler ADCs, and applications. Or drill down to an application view or network function view to troubleshoot performance and security issues faster. Service graphs are particularly helpful in Kubernetes environments where there are hundreds or thousands of endpoints to monitor.
transparent
Web insights
h3
NetScaler maintains detailed logs of every web transaction so you can troubleshoot more quickly. Isolate an ADC-to-client vs. an ADC-to-server issue. Dive deep into client network-latency and server response-time data. Get details on application access, including the most-accessed applications, all URLs accessed by clients, OS and browser details, applications with the most backend errors, and more.
transparent
Security insights
h3
The security insights dashboard monitors your application threat environment and provides a threat summary for all your applications and ADCs. You can see which applications have missing security configurations and which have high threat and low safety indexes. And you can quickly determine if and when a specific application was attacked.
transparent
SSL insights
h3
SSL analytics provide real-time and historical monitoring of all your secure web transactions (HTTPS). With SSL insights, you can determine how configuration changes like turning off SSLv3 or removing a cipher like RC4-MD5 will impact application performance and the application end-user experience. And you can assess whether any of your applications have weak security protocols, ciphers, or key strengths.
transparent
TCP insights
h3
NetScaler ADCs use TCP optimization to avoid network congestion in data transmission. The TCP speed report measures TCP file download and upload performance with and without TCP optimization. You can view key transport layer metrics like data volume, throughput, and speed to measure traffic volume through NetScaler ADCs and validate the benefits of TCP optimization.
transparent
Gateway insights
h3
NetScaler functions as a gateway to enforce secure remote access to internal-facing applications. To troubleshoot user access issues, you can use the gateway insights dashboard to identify for a specific user where the login issue lies: authentication vs. endpoint analysis vs. single sign-on.
transparent
HDX insights
h3
NetScaler provides reporting for a suite of technologies called HDX that was built to deliver a high-definition experience for users of virtual applications and desktops in on-premises Citrix environments. For faster troubleshooting, HDX insights reports provide real-time client and network latency metrics and end-to-end performance data for Citrix Virtual Apps and Desktops traffic.
transparent
ADC infrastructure analytics
h3
NetScaler collates all the telemetry data from your ADC instances and quantifies it with an instance score that defines the health of your ADCs. You can view the data in a summarized tabular view or in a detailed graphical view.